10-Year Treasury Yield
U.S. Treasury yields slipped on Monday as investors looked to key economic data slated for this week, including fresh inflation insights that could affect the direction of interest rates. The yield on the 10-year Treasury dropped nearly 5 basis points at 3.993%. The 2-year Treasury yield was last less than 1 basis point lower to 4.341%. Yields and prices move in opposite directions and one basis point equals 0.01%.
Consumer Credit
US consumer debt soared to new heights in the run-up to the holiday season. Consumer borrowing spiked by $23.75 billion in November, more than doubling economists’ expectations for a $9 billion increase and sending outstanding credit balances north of the $5 trillion mark for the first time on record, the Fed’s latest Consumer Credit report showed. The monthly increase during the critical holiday shopping month was driven by higher rates of revolving credit (which includes mostly credit cards), which soared by nearly $19.5 billion — the third-highest monthly increase on records that go back to 1943. Higher revolving debt balances can be a reflection of population growth and increased card usage, as well as higher rates of economy-powering consumer spending. The report does not show how the credit is being used or whether the outstanding balances are being paid off before interest starts to accrue.
International Trade in Goods and Services
Trade deficit contracts 2.0% to $63.2 billion. Imports decline 1.9%; exports fall 1.9%. Services exports were highest on record.Falling imports compress US trade deficit in November 2023.The U.S. trade deficit narrowed in November as imports of consumer goods fell to a one-year low amid slowing domestic demand, a trend that, if it persists in December, could result in trade having no impact on economic growth in the fourth quarter.The weakness of both exports and imports in November suggests that weaker growth overseas is now being matched by a softening in domestic demand too. The trade deficit contracted 2.0% to $63.2 billion, the Commerce Department's Census Bureau said. Data for October was revised slightly to show the trade gap widening to $64.5 billion instead of the previously reported $64.3 billion. Economists polled by Reuters had forecast the trade deficit would rise to $65.0 billion in November.
Risk - Geopolitical
nnnn
MBA Purchase Applications
Mortgage applications increased 9.9 percent from one week earlier, according to data from the Mortgage Bankers Association’s (MBA). The holiday adjusted Refinance Index increased 19 percent from the previous week and was 30 percent higher than the same week one year ago. The unadjusted Refinance Index increased 53 percent from the previous week and was 17 percent higher than the same week one year ago. The seasonally adjusted Purchase Index increased 6 percent from one week earlier. The unadjusted Purchase Index increased 40 percent compared with the previous week and was 16 percent lower than the same week one year ago.
Wholesale Tre (Pre) nnnn
Oil - Commodity
U.S. crude oil tops $75 after strikes against Iran-backed Houthis. Oil prices rose after Britain and the United States carried out military strikes against targets in Houthi-controlled areas of Yemen, U.S. officials said, as tensions in the Red Sea mount further. “We will confront the American aggression. Any American aggression will never remain without a response,” leader of the Yemen’s Houthis, Abdul-Malik al-Houthi, vowed. West Texas Intermediate and Brent futures spiked more than 4% to hit their highest levels since Dec. 27. U.S. crude oil jumped to $75.25 a barrel while the global benchmark touched $80.75. WTI and Brent were both trading above their 50-day moving averages for the first time since late October.
Jobless Claims
nnnn
Cosumer Price Index - CPI
Consumer prices rose 0.3% in December, higher than expected, pushing the annual rate to 3.4%. The prices consumers pay for goods and services rose 0.3% in December and were up 3.4% on the year. That was higher than Wall Street expectations and still a good deal away from the Fed’s 2% inflation target. The consumer price index increased 0.3% in December and 3.4% from a year ago, compared with respective estimates of 0.2% and 3.2 Excluding volatile food and energy prices, the so-called core CPI also rose 0.3% for the month and 3.9% from a year ago, compared with respective estimates of 0.3% and 3.8%. Much of the increase came due to rising shelter costs. The category rose 0.5% for the month and accounted for more than half the core CPI increase. Wages adjusted for inflation posted a 0.2% gain on the month, while rising a modest 0.8% from a year ago.
Treasury Budget
mmm
Fed Balance Sheet
nnnn
Producer Price Index - PPI
PPI report shows U.S. wholesale prices falling for third straight month. Wholesale prices unexpectedly fell 0.1% in December in positive inflation sign. Wholesale prices unexpectedly declined in December, providing a positive signal for inflation, the Labor Department reported Friday. The producer price index fell 0.1% for the month and ended 2023 up 1% from a year ago, the Labor Department reported Friday. Economists surveyed by Dow Jones had been looking for a monthly gain of 0.1%. The index had surged 6.4% in 2022. Excluding food and energy, core PPI was flat against the estimate for a 0.2% increase Excluding food, energy and trade services, PPI also was up 0.2%, in line with the estimate. For the full year, the final demand measure less food, energy and trade services rose 2.5% for all of 2023 after being up 4.7% in 2022. The PPI release comes a day after less encouraging news from the Labor Department, which reported Thursday that the prices consumers pay for goods and services rose 0.3% in December and were up 3.4% on the year. That was higher than Wall Street expectations and still a good deal away from the Fed’s 2% inflation target. However, PPI is generally considered a better leading index as it measures pipeline prices that companies get for intermediate goods and services. Markets reacted positively to the PPI release, with stock futures shaving losses and Treasury yields mostly lower. PPI measures the prices the producers pay for goods and services, while CPI gauges what consumers pay in the marketplace. CPI also includes imports whereas CPI does not. PPI, however, covers a broader set of goods and services.
Mortgage Rates
The average contract interest rate for 30-year fixed-rate mortgages with conforming loan balances ($726,200 or less) increased to 6.81 percent from 6.76 percent, with points remaining unchanged at 0.61 (including the origination fee) for 80 percent loan-to-value ratio (LTV) loans. The effective rate increased from last week. The average contract interest rate for 30-year fixed-rate mortgages backed by the FHA increased to 6.56 percent from 6.51 percent, with points decreasing to 0.84 from 0.86 (including the origination fee) for 80 percent LTV loans. The effective rate increased from last week.
Gold - Hedging
nnnn
JP Morgan
JPMorgan Chase profit falls after $2.9 billion fee from regional bank rescues. JPMorgan Chase said Friday that fourth-quarter profit declined after paying a $2.9 billion fee tied to the government seizures of failed regional banks last year. Here’s what the company reported versus what analysts surveyed by LSEG, formerly known as Refinitiv, expected: Earnings per share: $3.04, may not compare with $3.32 expected. Revenue: $39.94 billion vs. $39.78 billion expected.
Bank of America
Bank of America profit shrinks on $2.1 billion of charges. Shares of the second-largest U.S. lender were down nearly 1.2% in afternoon trading on Friday, after it posted net income of $3.1 billion, or 35 cents a share, for the three months ended Dec. 31. That compares with $7.1 billion, or 85 cents a share, a year earlier. "Bank of America reported modest Q4 results as the impact of interest rate headwinds was only partially offset by strong organic growth and good expense discipline.
Bitcoin Rates
Bitcoin losses accelerate following ETF launch, while ether heads for an 18% gain on week. The price of bitcoin dropped nearly 6% to $44,022.22, according to Coin Metrics, pulling most of the crypto market into the red, with some notable exceptions. UnitedHealth falls on higher-than-expected medical costs. Tesla falls after flagging output hit from Red Sea disruption. US producer prices unexpectedly fall in December
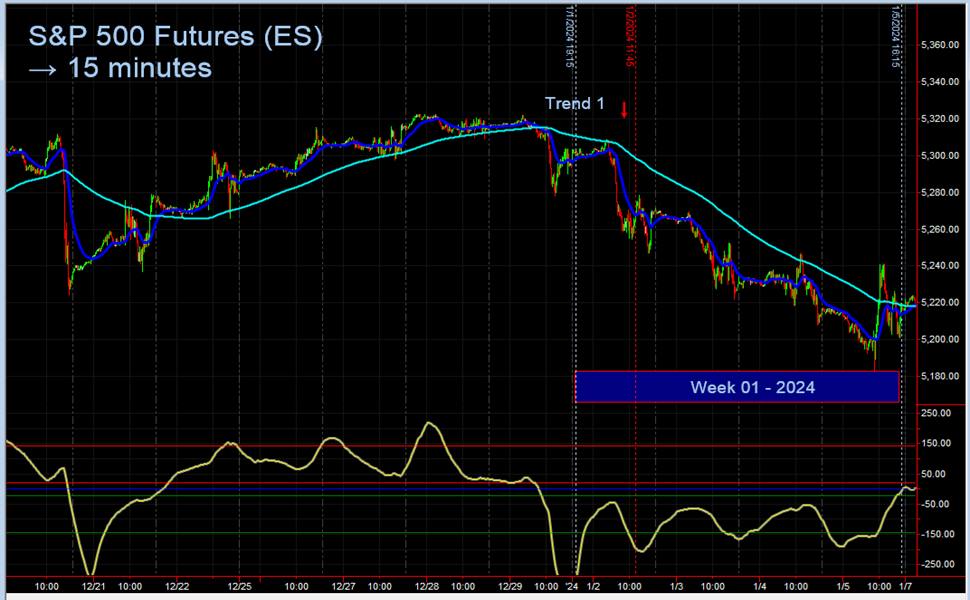
S&P 500 - Weekly Performance
nnnn |