10-Year Treasury Yield
Treasury yields are little changed as investors prepare for a potential Fed rate cut. U.S. Treasury yields were little changed on Monday as investors looked ahead to the Federal Reserve’s final meeting of the year this week. The 10-year Treasury yield was down less than 1 basis point at 4.393% after topping 4.4% on Friday. The 2-year Treasury yield was also down by less than 1 basis point at 4.236%.
NY Empire Estate Mfg index
NY Empire State Manufacturing Index Dips In December 2024. NY Empire State Manufacturing Index Plummets, Signaling Slowed Growth. The New York Empire State Manufacturing Index, a key indicator of general business conditions in New York state, has taken a substantial dive. The index, which is compiled from a survey of approximately 200 manufacturers in the state, fell to a mere 0.2. This dramatic drop in the index is significantly lower than the forecasted value of 6.4. The stark contrast between the actual and forecasted figures suggests that business conditions in New York state are not improving as expected. Instead, they are barely holding steady, as indicated by the index level just above 0.0, which denotes improving conditions.
PMI Composite Flash
U.S. Composite PMI rises to highest since March 2022 in December 2024. The S&P Global's U.S. Composite PMI rose to 56.6 in December's flash estimate from 54.9 in November, indicating the fastest expansion of business activity since March 2022 amid strength in the services economy and further deterioration in manufacturing production. A further climb in service sector activity (services PMI: 58.5 vs. 55.7 consensus and 56.1 prior) contrasted with a steeper fall in manufacturing production.
Retail Sales
U.S. retail sales rise 0.7% in November, above forecast.U.S. retail sales climb 0.7% in November, above 0.5% forecast. Retail sales minus autos increase 0.2% in November. U.S. retail sales increased more than expected in November as households stepped up purchases of motor vehicles and online merchandise, consistent with strong underlying momentum in the economy as the year winds down. The report from the Commerce Department on Tuesday had no impact on expectations that the Federal Reserve would cut interest rates on Wednesday for the third time since the U.S. central bank initiated its policy easing cycle in September. Retail sales increase 0.7% in November, above market expectations for 0.5% gain.
Industrial Production
US Industrial Production Unexpectedly Drops on Mining, Utilities. Manufacturing output rose a disappointing 0.2% in November. Aerospace equipment production fell despite strike resolution. US industrial production unexpectedly declined for a third month in November on weaker utility output and mining. The 0.1% decrease in production at factories, mines and utilities followed a downwardly revised 0.4% drop a month earlier, Federal Reserve data showed Tuesday. The median estimate of Bloomberg survey of economists was for a 0.3% increase. US industrial production continued to contract last month, the Federal Reserve said Tuesday, announcing a surprise slump and extending the decline for a third consecutive month. Industrial output fell by 0.1 percent in November after declining in both September and October, the Fed said in a statement.
Housing Market Index
NAHB December US housing market index 46 vs 47 expected. The creep higher in rates isn't going to help the undersupply of US housing, nor is the tough housing market in Florida. NAHB Housing Market Index Remains Unchanged At 46. NAHB Housing Market Index was unchanged at 46 in December, missing analyst estimates. The report indicated that NAHB Housing Market Index remained unchanged at 46 in December, while analysts expected that it would increase to 47. Current sales expectations remained unchanged at 48. Sales expectations in the next six months increased from 63 in November to 66 in December, reaching the highest level since April 2022. The report showed that traffic of prospective buyers declined from 32 in November to 31 in December.
Business Inventories
Business Inventories increased by 0.1% month-over-month in October, in line with analyst expectations. US business inventories barely rise in October 2024. U.S. business inventories edged up in October as modest increases in stocks at retailers and wholesalers were partially offset by a decline at manufacturers. Inventories rose 0.1% after being unchanged in September, the Commerce Department's Census Bureau said on Tuesday. The gain in inventories, a key component of gross domestic product, was in line with economists' expectations. Inventories increased 2.4% on a year-on-year basis in October. The pace of inventory accumulation could pick up in the months ahead as businesses stockpile goods in anticipation of higher import tariffs.
Geopolitical Risk
While global central banks insist their monetary policy decisions are made independently of the Fed, currency moves could force them to act. Though global central banks insist on independence in their monetary policy decisions, a stronger U.S. dollar on the back of higher interest rates — and potentially inflationary tariffs from President-elect Donald Trump — make the outlook for policy easing around the world more uncertain. The Bank of Japan on Thursday held its benchmark interest rate steady at 0.25%, opting to take the time to assess the impact of financial and foreign exchange markets on Japan’s economic activity and prices. The BOJ said in its statement that the decision to hold was split 8-1, with board member Naoki Tamura advocating for a 25-basis-point hike.
The Bank of England, meanwhile, left rates unchanged at 4.75% after U.K. inflation rose to an eight-month high in November according to data released earlier this week. The central bank’s decision was in line with expectations. U.K. inflation rose to 2.6% in November, the Office for National Statistics said Wednesday, marking the second straight monthly increase in the headline figure. The reading was in line with the forecast of economists polled by Reuters, and climbed from 2.3% in October. Core inflation, excluding energy, food, alcohol and tobacco, came in at 3.5%, just under a Reuters forecast of 3.6%.
The Bank of Japan on Thursday held its benchmark interest rate steady at 0.25%, surprising economists polled by Reuters, who expected a 25 basis points hike. The BOJ said in its statement that the decision to hold was a split 8-1 decision, with board member Naoki Tamura advocating for a 25-basis-point hike. Bank of Japan holds rates at 0.25%, yen weakens to one-month low. Japan’s GDP has seen a year-on-year contraction for the first two quarters of this year, only recording a 0.5% gain in the quarter ending September.
MBA Purchase Applications
Mortgage applications decreased 0.7 percent from one week earlier. The Market Composite Index, a measure of mortgage loan application volume, decreased 0.7 percent on a seasonally adjusted basis from one week earlier. On an unadjusted basis, the Index decreased 2 percent compared with the previous week. The Refinance Index decreased 3 percent from the previous week and was 41 percent higher than the same week one year ago. The seasonally adjusted Purchase Index increased 1 percent from one week earlier. The unadjusted Purchase Index decreased 2 percent compared with the previous week and was 6 percent higher than the same week one year ago.
Housing Starts
US single-family housing starts rebound; tariffs an obstacle. U.S. single-family homebuilding rebounded in November as the drag from hurricanes faded, but the threat of tariffs on imported goods and potential labor shortages from mass deportations of immigrants could hamper new construction next year. The report from the Commerce Department on Wednesday showed only a slight increase last month in permits for the future construction of single-family homes. US Housing Starts Fall to Four-Month Low on Multifamily Decline. Housing starts decreased 1.8% to an annualized rate of 1.29 million, the slowest since July, according to government data released Wednesday. The median forecast was for a 1.35 million pace.
Housing Permits
Building permits for single-family housing rise 0.1%. Building permits, which point toward future construction, increased 6.1% to a 1.51 million annualized rate, according to the government’s residential construction report. Authorizations for single-family homes were little changed at an annualized rate of 972,000. Highest Building Permits Since February Despite Slower Housing Starts. There is typically a solid buffer between permits and starts. After all, housing construction cannot "start" unless it is "permitted." Oftentimes, there's a divergence between housing starts and building permits on any given month. This is one of them.
Current Account
US current account deficit hits record high in the third quarter. The U.S. current account deficit widened to a record high in the third quarter amid a surge in imports and lower primary income receipts. The Commerce Department's Bureau of Economic Analysis said on Wednesday that the current account deficit, which measures the flow of goods, services and investments into and out of the country, increased $35.9 billion, or 13.1%, to an all-time high of $310.9 billion last quarter. Economists polled by Reuters had forecast the current account deficit at $284.0 billion. The current account gap represented 4.2% of gross domestic product, the highest since the first quarter of 2022, up from 3.7% in the April-June quarter. The deficit peaked at 6.3% of GDP in the fourth quarter of
Oil - Commodity
Oil settles up after US crude stocks fall, Fed’s 2025 outlook curbs gains. Oil prices settled higher on Wednesday after U.S. crude inventories fell and the U.S. Federal Reserve cut interest rates as expected, but gains were capped as the Fed signalled it would slow the pace of cuts. Brent futures settled up 20 cents, or 0.27%, to $73.39 a barrel. U.S. West Texas Intermediate crude settled up 50 cents, or 0.71%, to $70.58. Both benchmarks retreated from gains of more than $1 a barrel at session highs. U.S. crude stocks and distillate inventories fell while gasoline inventories rose in the week ending Dec. 13, the Energy Information Administration said on Wednesday. Total product supplied, a proxy for demand, was 20.8 million barrels per day, up 662,000 bpd from the prior week.
FOMC Meetings
Fed cuts by a quarter point, indicates fewer reductions ahead. The Federal Open Market Committee cut its overnight borrowing rate to a target range of 4.25%-4.5%, back to the level where it was in December 2022. “Today was a closer call but we decided it was the right call,” Chair Jerome Powell said. The Fed indicated that it probably would only lower twice more in 2025, according to the closely watched “dot plot” matrix of individual members’ future rate expectations. The Federal Reserve on Wednesday lowered its key interest rate by a quarter percentage point, the third consecutive reduction and one that came with a cautionary tone about additional cuts in coming years. In a move widely anticipated by markets, the Federal Open Market Committee cut its overnight borrowing rate to a target range of 4.25%-4.5%, back to the level where it was in December 2022 when rates were on the move higher. Stocks sold off sharply following the Fed announcement, with the Dow Jones Industrial Average closing down more than 1,100 points while Treasury yields soared. The central bank reduced its overnight borrowing rate by a quarter point to a target range of 4.25% to 4.5%, as expected. However, the Fed indicated Wednesday afternoon it would only cut rates twice in 2025, fewer than the four cuts given in its last forecast.
US Dollar - Currency
A stronger U.S. dollar on the back of higher interest rates — and potentially inflationary tariffs from President-elect Donald Trump — make the outlook for policy easing around the world more uncertain.
Jobless Claims
U.S. weekly jobless claims fall, while third-quarter economic growth rate rises. Initial U.S. jobless claims drop to 220,000 in Dec. 14 week from 242,000 in prior week Continuing jobless claims decline by 5,000 to 1.87 million.
GDP Gross Domestic Product
The U.S. economy was even stronger than it looked in the third quarter, GDP shows. We can thank consumers. US Gross Domestic Product grows by 3.1% in Q3 vs. 2.8% expected. US economy grew at a faster pace in Q3 than initially estimated. US Dollar Index stays in the red below 108.00. The United States' Gross Domestic Product (GDP) expanded at an annual rate of 3.1% in the third quarter, the US Bureau of Economic Analysis (BEA) reported in its final estimate on Thursday. This reading came in above the market expectation and the previous estimate of 2.8%.
Philadelphia Index
Philadelphia Region Manufacturing Weakens Again in Blow to Recovery Hopes. Manufacturing activity in the Philadelphia area fell back markedly this month, thwarting hopes for a post-election rebound. The Federal Reserve Bank of Philadelphia said Thursday that its index for business activity plunged to minus 16.4 in December from minus 5.5 in November, the lowest point since the first half of last year. That suggests activity decreased more rapidly this month, in contrast with economists' expectations for a rebound to the positive territory that would suggest a recovery in regional manufacturing. The Philadelphia Fed survey polls manufacturers in the Third Federal Reserve District, which covers eastern Pennsylvania, southern New Jersey and Delaware.
Corporate Profits
Real gross domestic income (GDI) increased 2.1 percent in the third quarter, a downward revision of 0.1 percentage point from the previous estimate. The average of real GDP and real GDI, a supplemental measure of U.S. economic activity that equally weights GDP and GDI, increased 2.6 percent in the third quarter, an upward revision of 0.1 percentage point from the previous estimate. Profits from current production (corporate profits with inventory valuation and capital consumption adjustments) decreased $15.0 billion in the third quarter, a downward revision of $4.9 billion from the previous estimate. Profits of domestic financial corporations increased $3.0 billion in the third quarter, an upward revision of $5.6 billion from the previous estimate. Profits of domestic nonfinancial corporations increased $24.9 billion, a downward revision of $5.9 billion. Rest-of-the-world profits decreased $42.9 billion, a downward revision of $4.6 billion. Receipts decreased $61.5 billion, and payments decreased $18.7 billion.
Existing Home Sales
November home sales surged more than expected, boosted by lower mortgage rates. Sales of previously owned homes rose 4.8% in November compared with October, according to the National Association of Realtors Sales were 6.1% higher than November 2023, the largest annual gain in three years. Sales of previously owned homes rose 4.8% in November compared with October, according to the National Association of Realtors. That put them at a seasonally adjusted, annualized rate of 4.15 million units.
Leading Indicators
November 2024 leading economic indicators and existing home sales show positive growth. The US LEI rose in November for the first time since February 2022. LEI for the US increased by 0.3% in November 2024 to 99.7 (2016=100), nearly reversing its 0.4% decline in October. Over the six-month period between May and November 2024, the LEI declined by 1.6%, slightly less than its 1.9% decline over the previous six months.
Treasury Intal Capital
The U.S. Department of the Treasury today released Treasury International Capital (TIC) data for October 2024. The next release, which will report on data for November 2024, is scheduled for January 17, 2025. The sum total in October of all net foreign acquisitions of long-term securities, short-term U.S. securities, and banking flows was a net TIC inflow of $203.6 billion. Of this, net foreign private inflows were $220.0 billion, and net foreign official outflows were $16.4 billion. Foreign residents increased their holdings of long-term U.S. securities in October; their net purchases were $136.3 billion. Net purchases by private foreign investors were $126.6 billion, while net purchases by foreign official institutions were $9.7 billion.
Fed Balance Sheet
Level Prior $6.896 T, Actual $6.898 T. Total Assets - W/W Prior $-9.313 B Actual $1.658 B Reserve Bank Credit - W/W Prior $-13.686 B, Actual $-4.330 B.
Mortgage Rates
The average contract interest rate for 30-year fixed-rate mortgages with conforming loan balances ($766,550 or less) increased to 6.75 percent from 6.67 percent, with points remaining unchanged at 0.66 (including the origination fee) for 80 percent loan-to-value ratio (LTV) loans. The effective rate increased from last week.
Personal Income
Personal income rose 0.3%, short of the 0.4% estimate. Personal income rose 0.3% after having jumped 0.7% in October, falling short of the 0.4% estimate. On spending, personal expenditures increased 0.4%, one-tenth of a percentage point below the forecast.
Consumer Spending
Personal expenditures increased 0.4%, one-tenth of a percentage point below the forecast. Income and spending numbers in the release also were a bit light compared with expectations. On spending, personal expenditures increased 0.4%, one-tenth of a percentage point below the forecast.
Core PCE
Key Fed inflation measure shows 2.4% rate in November, lower than expected. The PCE price index, the Fed’s preferred inflation gauge, showed an increase of just 0.1% from October and a 2.4% annual rate, both below expectations. Excluding food and energy, core PCE also increased 0.1% monthly and was 2.8% higher from a year ago, with both readings being 0.1 percentage point below the forecast. Excluding food and energy, core PCE also increased 0.1% monthly and was 2.8% higher from a year ago, with both readings also being 0.1 percentage point below the forecast. Fed officials generally consider the core reading to be a better gauge of long-run inflation trends as it excludes the volatile gas and groceries category.
Quadruple Witching
Traders brace for volatility with a record $6.6 trillion in options due to expire in Friday’s ‘triple witching’. The quarterly event will coincide with the release of the Fed’s preferred inflation report. It’s “triple-witching” time again, and Friday’s expiration promises to be the biggest ever, with options tied to more than $6 trillion in stocks, exchange-traded funds and indexes set to expire. Figures provided by Asym 500 showed $6.6 trillion set to expire, with others putting the notional value even higher, at $7.7 trillion.
Consumer Sentiment UM
Michigan Consumer Sentiment meets Forecast, shows Improvement over Previous Reading. The University of Michigan has released its Consumer Sentiment Index, a key indicator of the relative level of current and future economic conditions. The actual figure released stands at 74.0, a number that aligns perfectly with the forecasted figure.
Hedging - Gold
The U.S. dollar climbed following a hawkish forecast delivered by the U.S. Federal Reserve on Wednesday — while gold prices dropped. Values of the two tend to have an inverse relationship. Gold is widely denominated in dollars, with a stronger greenback weighing on prices for the precious metal. Higher interest rates and higher U.S. Treasury yields also traditionally increase competition for the safe-haven asset, dampening gold demand. The U.S. dollar jumped following the Fed news on Wednesday, with the dollar index hitting a two-year high, as the potential for higher rates was seen boosting the currency. Gold prices — which have been on a stunning run and scaled record highs this year — meanwhile tumbled 2% to their lowest level in a month.
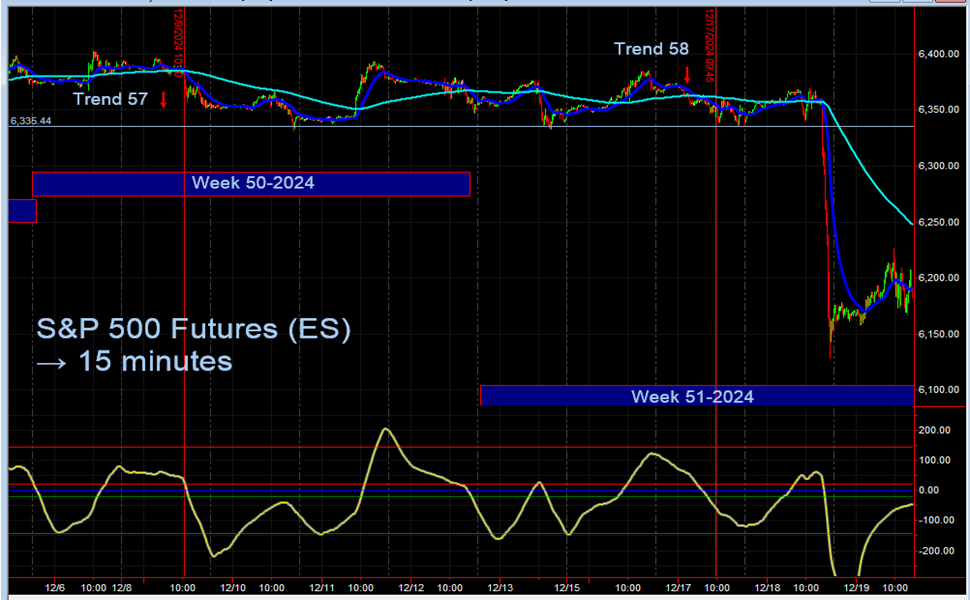
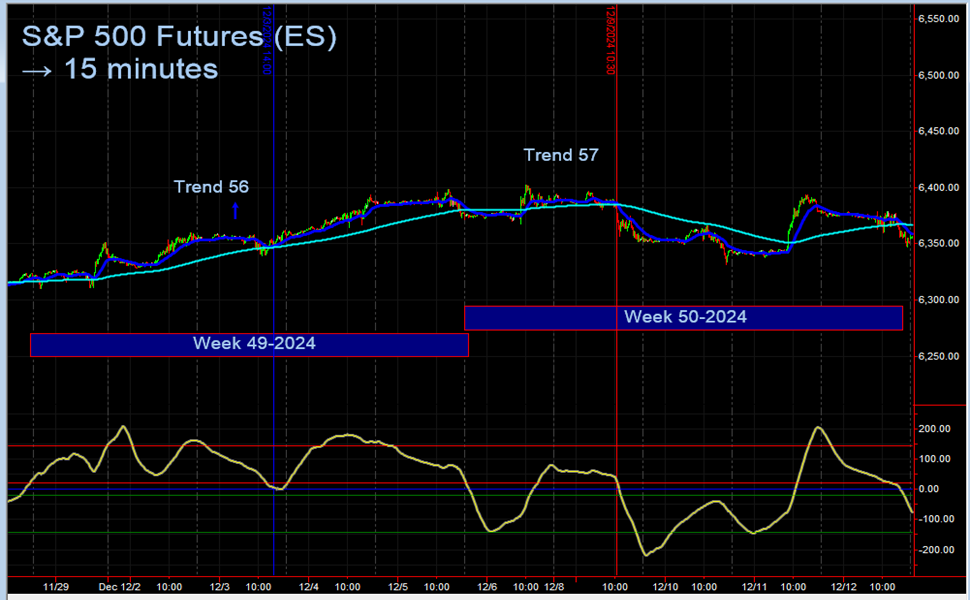
S&P 500 Index - Week Performance
mmm |