 |
 |
 |
|
|
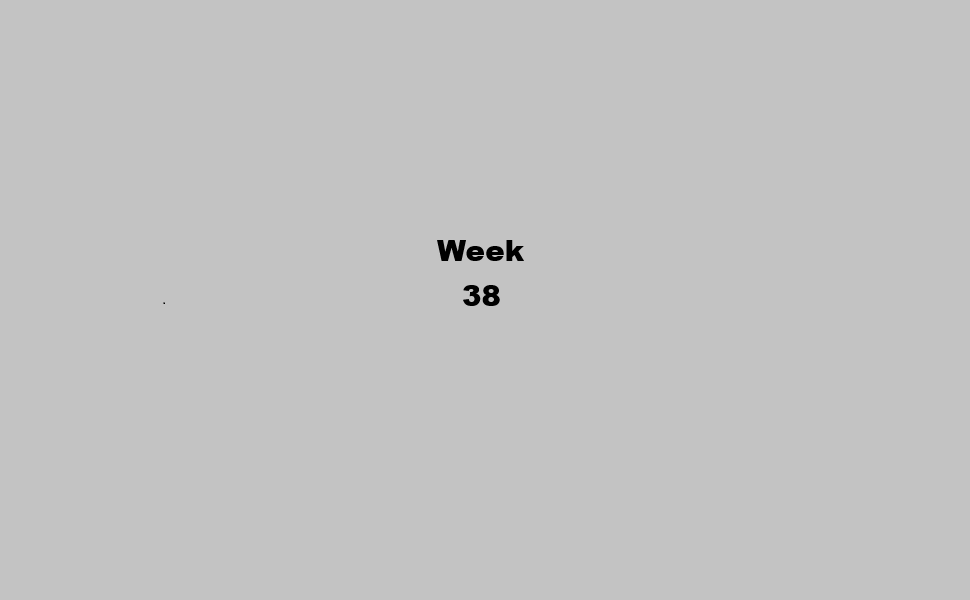
Week 38 -2022 | From Sep. 19 to Sep. 23, 2022 |
|
 |
|
|
|
|
|
|
|
| |
|
|
|
|
|
|
|
|
|
|
|
|
| |
|
|
|
|
You are not allowed to access this data
|
|
| |
|
|
|
|
|
|
|
|
|
|
|
|
| |
|
|
|
|
|
| |
|
|
|
|
|
|
|
|
|
|
|
|
| |
|
|
|
|
| |
|
| Week 38 -2022 | From Sep. 19 to Sep. 23, 2022 |
10-Year Treasury Yield
Treasury yields climbed on Monday as traders anticipated the Federal Reserve’s next moves in the face of persistently high inflation. The benchmark 10-year Treasury yield gained 6 basis points to 3.518%, hitting its highest level since April 2011, and was last up 2 basis points to 3.465%. The yield on the 2-year Treasury bond rose 8 basis points to trade at 3.942%, trading around levels not seen since 2007.
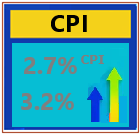
Fed Meeting The Fed’s two-day meeting will begin Tuesday, with most market participants expecting another 75-basis-point hike by the central bank. Some analysts have, however, argued the Fed could increase interest rates by a full point, or 100 basis points. It comes after inflation rose more than expected in August. The consumer price index increased 0.1% for the month and 8.3% over the past year — higher than economists expected. The data has led investors to expect the Fed to double down on higher interest rates for longer, until prices fall.
HMI
Homebuilding sector historically outperforms following early declines. More homebuilders lower prices as sentiment falls for ninth straight month. Homebuilder sentiment in September fell 3 points to 46 in the National Association of Home Builders/Wells Fargo Housing Market Index. Anything below 50 is considered negative. Nearly a quarter of builders reported lowering prices as rates surged. Higher costs for land, labor and materials have made it harder for builders to lower prices, but they are now being forced to.
Exisiting Hpme Sales
Existing home sales fall in August 2022, and prices soften significantly. Sales of previously owned homes fell 0.4% in August 2022 from July 2022 to a seasonally adjusted annualized rate of 4.80 million units, according to the National Association of Realtors. That is the slowest sales pace since June 2020, when activity stalled very briefly due to the start of the pandemic. Outside of that, it is the slowest pace since November 2015. Sales of previously owned homes fell 0.4% in August from July to a seasonally adjusted annualized rate of 4.80 million units, according to the National Association of Realtors. That is the slowest sales pace since May 2020, when activity stalled very briefly due to the start of the Covid pandemic. Outside of that, it is the slowest pace since November 2015. Sales were 19.9% lower than in August 2021. Homebuilders have been pulling back in the face of falling demand, but there was a small bump in single-family housing starts in August, according to the U.S. Census. That may have been due to a brief drop in mortgage rates during, which sparked more interest from buyers. But building permits, which are an indicator of future construction, fell as mortgage rates were expected to rise again. The 30-year fixed started this year at 3%. It is now close to 6.5%. Even with interest rates making housing less affordable, prices were still higher than a year ago. The median price of an existing home sold in August was $389,500, up 7.7% from a year ago. Home prices historically decline from July to August, due to seasonality, but the drop this year was wider than usual, suggesting a significant softening.
FOMC
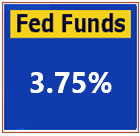
Fed raises rates by another three-quarters of a percentage point to fight inflation. The Federal Reserve on Wednesday raised benchmark interest rates by another three-quarters of a percentage point and indicated it will keep hiking well above the current level. In its quest to bring down inflation running near its highest levels since the early 1980s, the central bank took its federal funds rate up to a range of 3%-3.25%, the highest it has been since early 2008 following the third consecutive 0.75 percentage point move. The increases that started in March and from a point of near-zero mark the most aggressive Fed tightening since it started using the overnight funds rate as its principal policy tool in 1990. The only comparison was in 1994, when the Fed hiked a total of 2.25 percentage points; it would begin cutting rates by July of the following year. Along with the massive rate increases, Fed officials signaled the intention of continuing to hike until the funds level hits a “terminal rate,” or end point of 4.6% in 2023. Traders had fully priced in the 0.75 percentage point move and even had assigned an 18% chance of a full percentage point move, according to CME Group data. Futures contracts just prior to Wednesday’s meeting implied a 4.545% funds rate by April 2023.
Title 5
mmmm
Title 6
mmmm
Title 7
mmmm
MBA Purchase Applications
mmmmm
Title 8
mmmm
Title 9
mmmm
Title 10
mmmm.
Title 11
mmmm
Jobless Claims
mmmm
Title 12
mmmm
Title 13
mmmm
Title 14
mmmm
Title 15
mmmm
Title 16
mmmm
Fixed Mortgage Rates
mmmm |
|
| |
|
|
|
|
|
|
|
|
|
|
|
|
IMPORTANT NOTE: In an effort to comply with all applicable rules, regulations and disclosures please be so kind and read the "General Disclosure" below: |
| |
|
|
|
|
| GENERAL DISCLOSURE |
- The material contained on our Website and Economic Calendar must be used at your own risk. Material is believed to be reliable, but we do not guarantee its accuracy or validity, nor is Tradingvestor.com responsible for any errors or omissions which may occur. The analysis and/or recommendations made by Tradingvestor.com do not provide, imply, or otherwise constitute a guarantee of performance. All contents and recommendations are based on data and sources believed to be reliable, but accuracy and completeness cannot be guaranteed. It should not be assumed that future results will be profitable or will equal past performance, real, indicated or implied.Tradingvestor.com website and material contained therein is not a solicitation to participate in the Futures/Stocks/Options Market. This Economic Calendar does not include Earning Releases, Announced Stock Splits, Upcoming Initial Public Offerings with Underwritings or Rating Changes. Tradingvestor.com has attempted to verify the information contained in this calendar. However, any aspect of such info may change without notice. Unless indicated otherwise: economic data is from the U.S and intraday data is at least 20 minutes delayed; all prices are in the local currency; Time is U.S. Eastern Time. Furthermore, there is a very high degree of risk involved in trading.Tradingvestor.com assumes no responsibilities for your trading and investment results, please red our Risk Disclosure.
- Tradingvestor.com does not provide investment advice, and does not represent that any of the information or related analysis is accurate or complete at any time. All information on this website are for educational purposes only and are not intended to provide financial advice. Any statements about profits or income, expressed or implied, do not represent a guarantee. Your actual trading may result in losses as no trading system is guaranteed. You accept full responsibilities for your actions, trades, profit or loss, and agree to hold Tradingvestor.com and any authorized distributors of this information harmless in any and all ways. We respect your right to privacy, please click here to view our privacy policy.
- U.S. Government Required Disclaimer - Commodity Futures Trading Commission.
Futures and options trading has large potential rewards, but also large potential risk. You must be aware of the risks and be willing to accept them in order to invest in the futures and options markets. Don't trade with money you can't afford to lose. This website is neither a solicitation nor an offer to Buy/Sell futures or options. No representation is being made that any account will or is likely to achieve profits or losses similar to those discussed on this website. The past performance of any trading system or methodology is not necessarily indicative of future results.
- CFTC rule 4.41: Hypothetical or simulated performance results have certain limitations. Unlike an actual performance record, simulated results do not represent actual trading. Also, since the trades have not been executed, the results may have under-or-over compensated for the impact, if any, of certain market factors, such as lack of liquidity. Simulated trading programs in general are also subject to the fact that they are designed with the benefit of hindsight. No representation is being made that any account will or is likely to achieve profit or losses similar to those shown.
- Risk Warning: Trading foreign exchange on margin carries a high level of risk, and may not be suitable for all investors. The high degree of leverage can work against you as well as for you. Before deciding to invest in foreign exchange you should carefully consider your investment objectives, level of experience, and risk appetite. The possibility exists that you could sustain a loss of some or all of your initial investment and therefore you should not invest money that you cannot afford to lose. You should be aware of all the risks associated with foreign exchange trading, and seek advice from an independent financial advisor if you have any doubts. Our linking to these sites does not constitute an endorsement of any products, services or the information found on them. Once you link to another site you are subject to the policies of the new site. By using this site, you agree to the Terms of Service, Privacy Policy and Risk Disclosure. Copyright 2017 Tradingvestor, LLC. All rights reserved. If you have any questions regarding the Online Economic Calendar application, please contact us: click here.
THIS BRIEF STATEMENT CANNOT, OF COURSE, DISCLOSE ALL THE RISKS AND OTHER ASPECTS OF THE COMMODITY MARKETS AND EQUITY MARKETS. PLEASE READ MORE AT: TERMS OF SERVICE.
|
|
|
| |
|
|
|
|
|
| |
|
|
|
|
|