Tradingvesting..com
Week 05 - 2014
Prev Next
Back Next
First Last
Week 05 -2014 | From Jan. 27, 2014 to Jan. 31, 2014
Signals Chart Rating Weekly Rating TPO Weekly Summary TPO Weekly Week Ratings Blog-Week Blog-Week


Market Holidays
 
Mkt
Time
Mon - Jan. 27
Tue - Jan. 28
Wed - Jan. 29
Thu - Jan. 30
Fri - Jan. 31
    FOMC Meeting Begins Neutral View MBA Purchase Applications Negative View   Fixed Mortgage Rates Positive View
           
    ICSC-Goldman Index Positive View      
           
    Durable Good Orders Negative View   Jobless/Initial Claims Negative View
        Gross Domestic Product (GDP) Positive View
         
    Johnson Redbook Positive View     Employment Cost Index (ECI) Positive View
    S&P Case-Shiller HPI Negative View      
         
  New Home Sales Negative View Consumer Confidence Positive View   Pending Home Sales Negative View Consumer Sentiment Positive View
      EIA Crude Oil Report Neutral View EIA Natural Gas Report Neutral View


      FOMC Meeting #1 Announcement Negative View    


        Fed Balance Sheet Neutral View  
        Money Supply Neutral View  


S&P 500 | E-mini Futures
Week 05-2014
WEEK 05-2014
       
Top of Page
 
WEEK 05-2014
ECONOMIC REPORTS Positive View Negative View Neutral View RATING REPORTS HIGHLIGHTS OF WEEK 05-2014
01. Interest Rates
1
1
1
Neutral View
 
02. Growth
1
Positive View
 
03. Inflation
1
Neutral View
 
04. Employment
1
1
Neutral View
 
05. Real Estate
4
Negative View
 
06. Manufacturing
1
Negative View
 
07. Consumer
3
1
Positive View
 
08. Sales & Inventories
2
Positive View
 
09. Business Activity
Non Available
 
10. Government
1
Neutral View
 
11. Balance of Payments
Non Available
 
12. Money Supply
1
Neutral View
 
13. Banking System
Non Available
 
SUB-TOTAL REPORTS
8
8
4
Neutral View
 
MARKET CORRELATION Positive View Negative View Neutral View RATING MKT CORRELATION HIGHLIGHTS OF WEEK 05 -2014
COMMODITY - Oil
1
Neutral View
Rising commodity prices arouses fears of inflation.
COMMODITY - Natural Gas
1
Neutral View
If interest rates rise, bond funds will go down.
ECONOMIES - Europe
Non Available
Raising interest rates to combat inflation might stop economic expansion.
ECONOMIES - China
Non Available
If Economy starts to improve the dollar will strengthen and Gold will fall.
TOTAL REPORTS
8
8
6
Neutral View
Week 05, 2014 has been rated Neutral.
     
         
Top of Page
         
LEGENDS: Rating Explained Rating Explained Chart View Chart View Positive View Positive View Negative View Negative View Neutral View Neutral View N/A Non Available
         
Top of Page
       
   
WEEK 05-2014 ENDING JAN. 31
Reports Commentary

Housing: New-home sales fall 7% in December 2013

Sales of new single-family homes fell in December, but the whole of 2013 saw the highest sales level in five years, the government reported Monday.

Sales of new single-family homes dropped 7% in December to a seasonally adjusted annual rate of 414,000, but were up 4.5% from a year earlier, the U.S. Commerce Department reported.

For all of 2013, new-home sales hit 428,000, the most since 2008. Despite growth over 2013, sales remain far below a peak rate of almost 1.4 million in 2005.

The median price of new homes rose 0.6% in December to $270,200. For 2013, the median price hit $265,800, up 8.4% from the prior year, the strongest annual growth since 2005. The supply of new homes on the U.S. market rose to 5 months in December at the current sales pace from 4.7 months in November.

The news out of housing keeps getting worse and worse. The latest bad news is a severe and much weaker-than-expected 8.7 percent decline in pending home sales for December. This points to a sharp decline ahead for what was already a very soft existing home sales market. All regions show similar declines in today's report.

This Week

Indexes tested key technical levels adding to the steep losses from their worst week in over a year, after downbeat data from China and selloffs in emerging-markets currencies triggered a global flight from equities.

Investors will also focus on the Federal Reserve this week as the central bank will take center stage on Wednesday. Most observers expect the central bank to cut its bond-buying again, by about $10 million to $65 billion a month. Expectations of Fed tapering are among the reasons Wall Street suffered its worst weekly performance in more than a year last week.

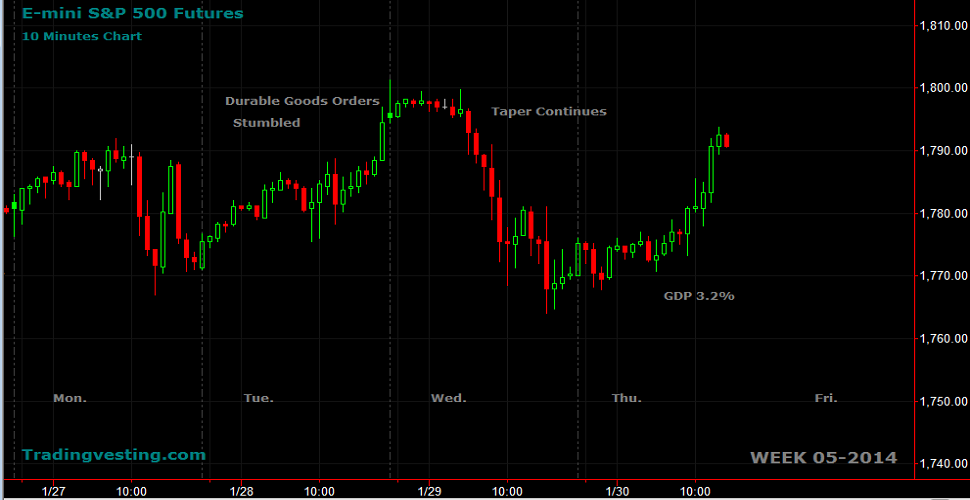
In the news Tuesday was mixed economic news. In the plus column was a solid weekly Redbook weekly retail sales report along with gains in Consumer Confidence. In the minus column was a wickedly poor Durable Goods report.

Taper Continues

In a statement after a two-day meeting, Fed policymakers said the central bank will buy $65 billion a month in Treasury bonds and mortgage-backed securities, down from $75 billion. In December, Fed policymakers took their first step in tapering the program begun in September 2012, reducing the bond-buying from $85 billion a month.

GDP

The U.S. government announced Thursday that the economy grew at a solid 3.2% pace in the third quarter, driven by strong consumer spending and exports. That figure beat economists' expectations, and although it's not indicative of gangbusters growth, the data seems to show the economy is moving forward modestly.

The U.S. economy expanded rapidly in the final quarter of 2013, the Commerce Department said on Thursday, as consumers shrugged off a government shutdown, with the data fueling hopes of even faster growth ahead. The gross domestic product grew at 3.2% annual pace, largely in line with expectations.

What do the Economic Reports reveal about the state of the economy?

New-home sales last year were best since recession but well below 2005 peak.

Sales of new single-family homes fell in December, but the whole of 2013 saw the highest sales level in five years, the government reported Monday. Sales of new single-family homes dropped 7% in December due to harsh winter weather. The median price of new homes ticked up in December and for 2013, the median price hit $265,800, up 8.4% from the prior year, the strongest annual growth since 2005.


    To prepare for this week we have posted the following Blog:    
    Blog for Week 05 -2014    
         
Top of Page
         
  IMPORTANT NOTE: In an effort to comply with all applicable rules, regulations and disclosures please be so kind and read the "General Disclosure" below:
     
Related Links
Terms of Service  
  Privacy Policy  
  Risk Disclosure  
  Refund Policy  
  User Agreement  
  Secure Website  
  Global View  
  Contact us  
 
GENERAL DISCLOSURE - TRADINGVESTING.COM
       
         
Top of Page
         
Interest Rates
Interest Rates
Meetings
Minutes
Beige Book
Growth
Growth
GDP
US Balance
Spending
Inflation
Growth
CPI
Core PCE
PPI
Employment
Employment
Payroll
Rate
ADP
Manufacturing
Manufacturing
ISM Mfg
Industrial
Factory
Real Estate
Real Estate
Starts
Permits
Shiller
stock market, online trading, ETF, portfolio, dividends, crypto, day trading, shares, how to start investing, broker, day trading, IPO, bull market, bear market, how to invest, margin account, futures, stock market today, stock market futures, investing, stock signals, stock alerts, stockmarket, alerts
 
 
Calendar | 52-Weeks | Global | Trend500 | Top News | Reports | Charts | Indexes | Today
Vix | Oil | ETFs | Stocks | Futures | 10-Year | S&P 500 | Markets | Register
About | Contact | Log-in | Register | WeDo | Times | Links
Disclaimer | Privacy Policy | Risk Disclosure
 
Tradingvesting.com | Trading and Investing
 
All Rights Reserved | www.tradingvesting.com | © Copyright 2008
Discipline - Confidence - Patience