|
| No |
Year |
IndexOpen |
IndexHigh |
IndexLow |
IndexClose |
IndexChange |
Return% |
W/B |
U/D |
| 54 |
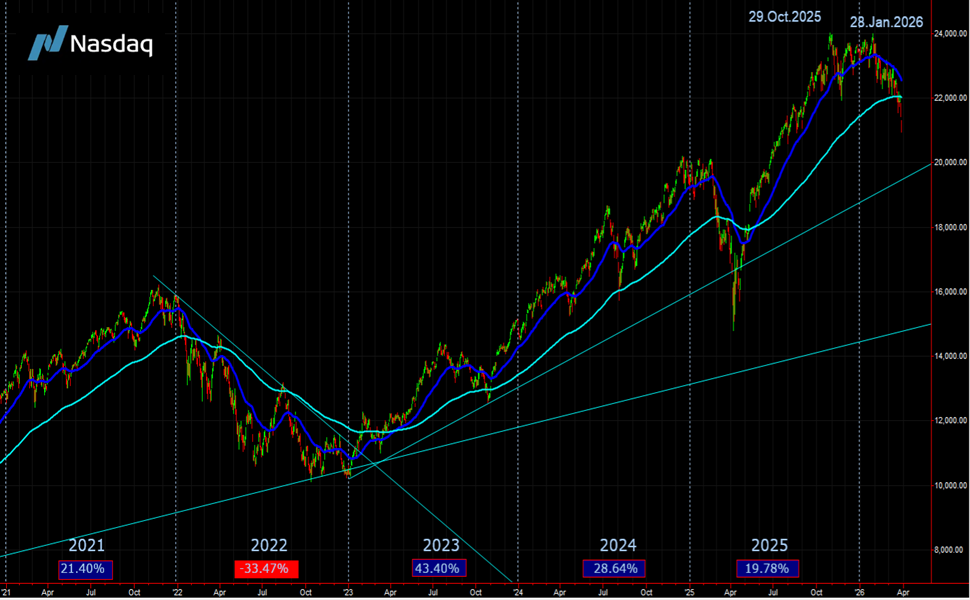
2024 |
15,011.35 |
20,204.58 |
14,477.57 |
19,310.79 |
4,299.44 |
28.64% |
|
 |
| 53 |
2023 |
10,466.48 |
15,150.07 |
10,265.04 |
15,011.35 |
4,544.87 |
43.42% |
|
|
| 52 |
2022 |
15,644.97 |
15,852.14 |
10,088.83 |
10,466.48 |
-5,178.49 |
-33.10% |
|
 |
| 51 |
2021 |
12,888.28 |
16,057.44 |
12,609.16 |
15,644.97 |
2,756.69 |
21.39% |
|
|
| 50 |
2020 |
8,972.60 |
12,899.42 |
6,860.67 |
12,888.28 |
3,915.68 |
43.64% |
|
|
| 49 |
2019 |
6,635.28 |
9,022.39 |
6,463.50 |
8,972.60 |
2,337.32 |
35.23% |
|
|
| 48 |
2018 |
6,903.39 |
8,109.69 |
6,192.92 |
6,635.28 |
−268.11 |
−3.88% |
|
|
| 47 |
2017 |
5,383.12 |
7,003.89 |
5,383.12 |
6,903.39 |
1,520.27 |
28.24% |
|
|
| 46 |
2016 |
5,007.41 |
5,487.41 |
4,209.76 |
5,383.12 |
375.71 |
7.50% |
|
|
| 45 |
2015 |
4,736.05 |
5,231.94 |
4,292.14 |
5,007.41 |
271.36 |
5.73% |
|
|
| 44 |
2014 |
4,176.59 |
4,814.95 |
4,103.88 |
4,736.05 |
559.46 |
13.40% |
|
|
| 43 |
2013 |
3,019.51 |
4,177.73 |
3,019.51 |
4,176.59 |
1,157.08 |
38.32% |
|
|
| 42 |
2012 |
2,605.15 |
3,196.93 |
2,605.15 |
3,019.51 |
414.36 |
15.91% |
|
|
| 41 |
2011 |
2,652.87 |
2,878.94 |
2,298.89 |
2,605.15 |
−47.72 |
−1.80% |
|
|
| 40 |
2010 |
2,269.15 |
2,675.26 |
2,100.17 |
2,652.87 |
383.72 |
16.91% |
|
|
| 39 |
2009 |
1,577.03 |
2,295.80 |
1,265.62 |
2,269.15 |
692.12 |
43.89% |
|
|
| 38 |
2008 |
2,652.28 |
2,661.50 |
1,295.48 |
1,577.03 |
−1,075.25 |
−40.54% |
Worst |
|
| 37 |
2007 |
2,415.29 |
2,861.51 |
2,331.57 |
2,652.28 |
236.99 |
9.81% |
|
|
| 36 |
2006 |
2,205.32 |
2,470.95 |
2,012.68 |
2,415.29 |
209.97 |
9.52% |
|
|
| 35 |
2005 |
2,175.44 |
2,278.16 |
1,889.83 |
2,205.32 |
29.88 |
1.37% |
|
|
| 34 |
2004 |
2,003.37 |
2,185.56 |
1,750.82 |
2,175.44 |
172.07 |
8.59% |
|
|
| 33 |
2003 |
1,335.51 |
2,015.23 |
1,253.22 |
2,003.37 |
667.86 |
50.01% |
|
|
| 32 |
2002 |
1,950.40 |
2,098.88 |
1,108.49 |
1,335.51 |
−614.89 |
−31.53% |
worst |
|
| 31 |
2001 |
2,470.52 |
2,892.36 |
1,387.06 |
1,950.40 |
−520.12 |
−21.05% |
|
|
| 30 |
2000 |
4,069.31 |
5,132.52 |
2,288.16 |
2,470.52 |
−1,598.79 |
−39.29% |
|
|
| 29 |
1999 |
2,192.69 |
4,090.61 |
2,192.69 |
4,069.31 |
1,876.62 |
85.59% |
|
|
| 28 |
1998 |
1,570.35 |
2,202.63 |
1,465.61 |
2,192.69 |
622.34 |
39.63% |
|
|
| 27 |
1997 |
1,291.03 |
1,748.78 |
1,194.16 |
1,570.35 |
279.32 |
21.64% |
|
|
| 26 |
1996 |
1,052.13 |
1,328.95 |
977.79 |
1,291.03 |
238.9 |
22.71% |
|
|
| 25 |
1995 |
751.96 |
1,074.85 |
751.96 |
1,052.13 |
300.17 |
39.92% |
Best |
|
| 24 |
1994 |
776.8 |
800.63 |
690.95 |
751.96 |
−24.84 |
−3.20% |
|
|
| 23 |
1993 |
676.95 |
791.2 |
644.71 |
776.8 |
99.85 |
14.75% |
|
|
| 22 |
1992 |
586.34 |
676.95 |
545.95 |
676.95 |
90.91 |
15.45% |
|
|
| 21 |
1991 |
373.8 |
586.35 |
353 |
586.34 |
212.54 |
56.86% |
|
|
| 20 |
1990 |
454.8 |
470.3 |
323 |
373.8 |
−81.00 |
−17.81% |
|
|
| 19 |
1989 |
381.4 |
487.5 |
376.9 |
454.8 |
73.4 |
19.24% |
|
|
| 18 |
1988 |
330.50 |
397.50 |
329.00 |
381.40 |
50.90 |
15.40% |
|
|
| 17 |
1987 |
348.80 |
456.30 |
288.50 |
330.50 |
−18.30 |
−5.25% |
|
|
| 16 |
1986 |
324.90 |
384.00 |
322.10 |
348.80 |
23.90 |
7.36% |
|
|
| 15 |
1985 |
247.10 |
325.60 |
245.80 |
324.90 |
77.80 |
31.49% |
|
|
| 14 |
1984 |
278.60 |
287.90 |
225.30 |
247.10 |
−31.50 |
−11.31% |
|
|
| 13 |
1983 |
232.41 |
286.07 |
230.59 |
278.60 |
46.19 |
19.87% |
|
|
| 12 |
1982 |
195.84 |
240.70 |
159.14 |
232.41 |
36.57 |
18.67% |
|
|
| 11 |
1981 |
202.34 |
223.47 |
175.03 |
195.84 |
−6.50 |
−3.21% |
|
|
| 10 |
1980 |
151.84 |
206.19 |
124.09 |
202.34 |
50.5 |
33.26% |
Best |
|
| 9 |
1979 |
117.98 |
151.14 |
117.84 |
151.84 |
33.86 |
28.70% |
|
|
| 8 |
1978 |
105.05 |
139.25 |
99.09 |
117.98 |
12.93 |
12.31% |
|
|
| 7 |
1977 |
97.88 |
105.05 |
93.66 |
105.05 |
7.17 |
7.33% |
|
|
| 6 |
1976 |
77.62 |
97.88 |
77.06 |
97.88 |
20.26 |
26.10% |
|
|
| 5 |
1975 |
59.82 |
88.00 |
59.82 |
77.62 |
17.80 |
29.76% |
|
|
| 4 |
1974 |
92.19 |
96.53 |
54.87 |
59.82 |
−32.37 |
−35.11% |
Worst |
|
| 3 |
1973 |
133.73 |
136.84 |
88.67 |
92.19 |
−41.54 |
−31.06% |
Worst |
|
| 2 |
1972 |
114.12 |
135.15 |
113.65 |
133.73 |
19.61 |
17.18% |
|
|
| 1 |
1971 |
100.00 |
114.12 |
99.68 |
114.12 |
14.12 |
14.12% |
|
|
|
|
|
|
|
|
|
|
|
|
| ... |
... |
... |
... |
... |
... |
... |
... |
... |
... |
|
|
|
|
|
|
|
|
|
|
|
|
|
|
|
|
|
|
|
|
|
|
|
|