 |
|
 |
 |
 |
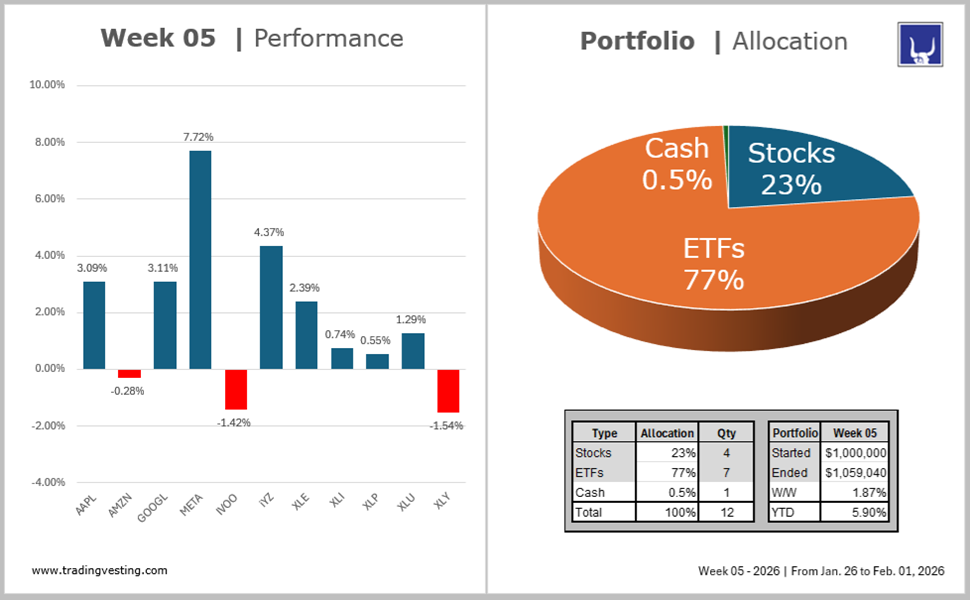
Week 05 - 2026 | From Jan. 26 to Feb. 01, 2026 |
|
 |
|
|
|
|
|
|
|
 |
|
Simulated Portfolio | 2026 |
 |
|
Tradingvesting.com | Week 05 |
 |
|
 |
|
|
|
|
|
|
|
|
|
|
|
|
|
|
|
| Portfolio | Positions |
Porfolio | Allocation |
26.Jan.26 |
30.Jan.26 |
Week 05 |
Portfolio | End |
| No |
Type |
Ticker |
Date |
Days |
Mov |
Allo |
Initial |
Qty |
Paid |
Open |
Close |
Pts |
W/W |
U/D |
End Wk |
Result |
| 1 |
Stock |
AAPL |
26.Jan.26 |
0 |
Enter |
5.6% |
$56,583 |
225 |
$251.48 |
$251.48 |
$259.24 |
7.76 |
3.09% |
 |
$58,329 |
$1,746 |
| 2 |
Stock |
AMZN |
05.Jan.26 |
21 |
Hold |
5.9% |
$59,498 |
260 |
$228.84 |
$239.98 |
$239.30 |
-0.68 |
-0.28% |
 |
$62,218 |
$2,720 |
| 3 |
Stock |
GOOG |
05.Jan.26 |
21 |
Hold |
5.4% |
$54,002 |
170 |
$317.66 |
$327.81 |
$338.00 |
10.19 |
3.11% |
|
$57,460 |
$3,458 |
| 4 |
Stock |
META |
26.Jan.26 |
0 |
Enter |
6.0% |
$59,862 |
90 |
$665.13 |
$665.13 |
$716.50 |
51.37 |
7.72% |
|
$64,485 |
$4,623 |
|
|
|
|
|
|
|
|
|
|
|
|
|
|
|
|
|
|
| 5 |
ETF |
IVOO |
05.Jan.26 |
21 |
Hold |
10.8% |
$108,110 |
951 |
$113.68 |
$118.05 |
$116.37 |
-1.68 |
-1.42% |
|
$110,668 |
$2,558 |
| 6 |
ETF |
IYZ |
05.Jan.26 |
21 |
Hold |
11.0% |
$110,054 |
3,217 |
$34.21 |
$34.35 |
$35.85 |
1.50 |
4.37% |
|
$115,329 |
$5,276 |
| .. |
ETF |
VNQ |
05.Jan.26 |
21 |
Exit |
... |
... |
1,245 |
$88.30 |
$91.82 |
... |
... |
... |
... |
... |
... |
| 7 |
ETF |
XLE |
05.Jan.26 |
21 |
Hold |
11.0% |
$110,011 |
2,460 |
$44.72 |
$49.87 |
$51.06 |
1.19 |
2.39% |
|
$125,608 |
$15,596 |
| 8 |
ETF |
XLI |
05.Jan.26 |
21 |
Hold |
11.0% |
$110,023 |
707 |
$155.62 |
$164.22 |
$165.44 |
1.22 |
0.74% |
|
$116,966 |
$6,943 |
| 9 |
ETF |
XLP |
05.Jan.26 |
21 |
Hold |
11.0% |
$109,980 |
1,418 |
$77.56 |
$83.05 |
$83.51 |
0.46 |
0.55% |
|
$118,417 |
$8,437 |
| 10 |
ETF |
XLU |
19.Jan.26 |
7 |
Hold |
11.8% |
$118,494 |
2,748 |
$43.12 |
$42.70 |
$43.25 |
0.55 |
1.29% |
|
$112,320 |
$338 |
| 11 |
ETF |
XLY |
05.Jan.26 |
21 |
Hold |
11.0% |
$109,910 |
924 |
$118.95 |
$123.06 |
$121.17 |
-1.89 |
-1.54% |
|
$111,961 |
$2,051 |
|
|
|
|
|
|
|
|
|
|
|
|
|
|
|
|
|
| 1 |
Liq |
Cash |
19.Jan.26 |
7 |
Hold |
0.2% |
$5,279 |
1 |
... |
... |
... |
... |
.... |
|
$5,279 |
$5,279 |
| 12 |
Positions |
|
|
Total |
100% |
$1,005,294 |
|
|
|
|
|
Finished |
$1,059,040 |
$59,025 |
| |
|
|
|
Started |
$1,000,016 |
|
|
|
|
|
Week 05 |
$18,706 |
1.87% |
| |
|
|
|
|
|
|
|
|
|
|
|
YTD |
$59,040 |
5.90% |
 |
View Chart |
 |
|
|
|
| |
|
|
|
|
|
|
|
|
|
|
|
|
|
Portfolio Model | 2026 |
|
|
Performance | Week 05 |
|
|
 |
|
|
|
|
|
|
|
|
|
|
|
|
| Year 2026 |
Portfolio Weekly |
S&P 500 Index |
View |
| Week |
From |
To |
Pos |
End Week |
W/W |
W/W% |
U/D |
YTD |
YTD% |
U/D |
%Chg |
Wk |
YTD |
Yr |
Details |
|
02.Jan.26 |
05.Jan.06 |
0 |
$1,000,000 |
$0 |
0.00% |
 |
$0 |
0% |
|
-0.29% |
|
-0.29% |
|
 |
|
05.Jan.26 |
11.Jan.26 |
10 |
$1,028,468 |
$28,466 |
2.85% |
|
$28,456 |
2.85% |
|
1.07% |
|
1.28% |
|
|
|
12.Jan.26 |
18.Jan.26 |
10 |
$1,039,416 |
$10,948 |
1.09% |
|
$39,414 |
3.94% |
|
-0.06% |
|
0.90% |
|
|
|
19.Jan.26 |
25.Jan.26 |
11 |
$1,040,334 |
$918 |
0.09% |
|
$40,334 |
4.03% |
|
0.73% |
|
0.55% |
|
|
|
26.Jan.26 |
01.Feb.26 |
12 |
$1,059,040 |
$18,706 |
1.87% |
|
$59,040 |
5.90% |
|
0.18% |
|
0.84% |
|
|
| __________ |
_________ |
_________ |
_____ |
___________ |
__________ |
________ |
____ |
__________ |
________ |
____ |
_______ |
____ |
_______ |
____ |
_________ |
|
|
| |
|
|
|
|
|
|
|
| |
|
|
| PORTFOLIO MODEL - WEEK 05 |
Portfolio Model → Long-Term Investing
In a nutshell....
- Monday, 26.Jan.2026 at open, time 9:30 am
- We Exit VNQ Real Estate
- We Entered Stock - Apple
- We Entered Stock - META
- Stocks → AMZN, GOOG, AAPL, META
- ETFs → IVOO, IYZ, XLE, XLI, XLP, XLU, XLY
- We Entered Cash Liquidity
- Out of the 12 positions: 4 Stocks and 7 ETFs
- Allocation: 23% Stocks and 77% ETFs.
- Cash 0.5%
- The Week Finished with a Balance of $18,706 and a Total of $1.059.040
- Tradingvesting → W/W 1.87%, YTD 5.90%
- S&P 500 Index → W/W 0.18%, YTD 0.84%
- We started the Year with a $1,000,000 Portfolio.
Not considered....
- Broker Commissions
- Dividends
- Interest on idle Cash
Read: CFTC rule 4.41: Hypothetical or Simulated Performance Results
|
|
|
|
| |
| |
|
|
|
|
|
|
|
|
|
|
|
|
|
|
|
|
|
In a Nutshell | We Did... |
|
|
Explain... |
|
|
|
|
|
|
|
|
|
|
|
|
|
|
|
| |
|
|
|
|
| |
|
|
| |
Portfolio Model Week 05 | From Jan 26 to Feb 01, 2026 |
| |
|
|
| |
|
|
|
|
|
|
|
|
|
|
|
|
|
|
|
|
|
1. |
What We Enter |
|
|
|
2. |
What We Exit |
|
|
|
| |
|
|
|
|
|
|
|
|
|
|
|
|
|
|
|
| |
|
Instrument |
Initial |
Qty |
Enter |
Date |
|
Instrument |
Initial |
Qty |
Exit |
Date |
|
| |
|
|
|
|
|
|
|
|
|
|
|
|
|
| |
|
 |
No Entries |
|
|
|
|
|
|
No Exits |
|
|
|
|
|
| |
|
|
|
|
|
|
|
|
|
|
|
|
|
|
|
| |
|
|
|
|
|
|
|
|
|
|
|
|
|
|
|
| |
|
|
|
|
|
|
|
|
|
|
|
|
|
|
|
| |
|
|
|
|
|
|
|
|
|
|
|
|
|
|
|
| |
|
|
|
|
|
|
|
|
|
|
|
|
|
|
|
| |
|
|
|
|
|
|
|
|
|
|
|
|
|
|
|
| |
|
|
|
|
|
|
|
|
|
|
|
|
|
|
|
| |
|
3. |
End-Week Allocation |
|
|
|
4. |
End-Week Review |
|
|
|
| |
|
|
|
|
|
|
|
|
|
|
|
|
|
|
|
| |
|
Instrument |
Allo% |
Qty |
Total |
|
|
Period - Week |
TraInv |
S&P 500 |
|
|
|
| |
|
|
Stocks |
23.0% |
4 |
$242,492 |
|
|
|
Week 04 |
$1.040,334 |
|
|
|
|
| |
|
|
ETF |
77.0% |
7 |
$811,270 |
|
|
|
Week 05 |
$1,059.040 |
|
|
|
|
| |
|
|
Cash |
0.5% |
1 |
$5,279 |
|
|
|
W/W% |
1.87% |
0.18% |
|
|
|
| |
|
|
Total |
100% |
12 |
$1,059,040 |
|
|
|
YTD % |
5.90% |
0.84% |
|
|
|
| |
|
|
|
|
|
|
|
|
|
|
|
|
|
|
| |
|
5. |
Description |
|
|
|
|
6. |
Holdings |
|
|
|
| |
|
|
|
|
|
|
|
|
|
|
|
|
|
|
|
| |
|
|
On Monday Jan 26, we Enter 0 Stocks and 0 ETFs. |
|
|
Stocks: AMZN, GOOG |
|
| |
|
|
We did not Exit any positions because we were 100% Cash. |
|
|
ETF: IVOO. IYZ, VNQ, XLED, XLI, XLP, XLV, XLY |
|
| |
|
|
The week Ended neutral at 1.87% and the SP 500 at 0.18% |
|
|
Cash: $5,279 |
|
| |
|
|
|
|
|
|
|
|
|
|
|
|
|
|
|
| |
|
|
|
|
|
|
|
|
|
|
|
|
|
|
|
|
|
|
| |
|
|
|
|
| |
|
|
|
|
|
| |
|
|
|
|
|
|
|
|
|
| |
|
|
|
|
|
|
| |
|
|
| GENERAL DISCLOSURE |
- The material contained on our Website and Economic Calendar must be used at your own risk. Material is believed to be reliable, but we do not guarantee its accuracy or validity, nor is Tradingvesting.com responsible for any errors or omissions which may occur. The analysis and/or recommendations made by Tradingvesting.com do not provide, imply, or otherwise constitute a guarantee of performance. All contents and recommendations are based on data and sources believed to be reliable, but accuracy and completeness cannot be guaranteed. It should not be assumed that future results will be profitable or will equal past performance, real, indicated or implied.Tradingvesting.com website and material contained therein is not a solicitation to participate in the Futures/Stocks/Options Market. This Economic Calendar does not include Earning Releases, Announced Stock Splits, Upcoming Initial Public Offerings with Underwritings or Rating Changes. Tradingvesting.com has attempted to verify the information contained in this calendar. However, any aspect of such info may change without notice. Unless indicated otherwise: economic data is from the U.S and intraday data is at least 20 minutes delayed; all prices are in the local currency; Time is U.S. Eastern Time. Furthermore, there is a very high degree of risk involved in trading.Tradingvesting.com assumes no responsibilities for your trading and investment results, please red our Risk Disclosure.
- Tradingvesting.com does not provide investment advice, and does not represent that any of the information or related analysis is accurate or complete at any time. All information on this website are for educational purposes only and are not intended to provide financial advice. Any statements about profits or income, expressed or implied, do not represent a guarantee. Your actual trading may result in losses as no trading system is guaranteed. You accept full responsibilities for your actions, trades, profit or loss, and agree to hold Tradingvesting.com and any authorized distributors of this information harmless in any and all ways. We respect your right to privacy, please click here to view our privacy policy.
- U.S. Government Required Disclaimer - Commodity Futures Trading Commission.
Futures and options trading has large potential rewards, but also large potential risk. You must be aware of the risks and be willing to accept them in order to invest in the futures and options markets. Don't trade with money you can't afford to lose. This website is neither a solicitation nor an offer to Buy/Sell futures or options. No representation is being made that any account will or is likely to achieve profits or losses similar to those discussed on this website. The past performance of any trading system or methodology is not necessarily indicative of future results.
- CFTC rule 4.41: Hypothetical or simulated performance results have certain limitations. Unlike an actual performance record, simulated results do not represent actual trading or investing. Also, since the trades have not been executed, the results may have under-or-over compensated for the impact, if any, of certain market factors, such as lack of liquidity. Simulated trading and investing programs in general are also subject to the fact that they are designed with the benefit of hindsight. No representation is being made that any account will or is likely to achieve profit or losses similar to those shown.
- Risk Warning: Trading foreign exchange on margin carries a high level of risk, and may not be suitable for all investors. The high degree of leverage can work against you as well as for you. Before deciding to invest in foreign exchange you should carefully consider your investment objectives, level of experience, and risk appetite. The possibility exists that you could sustain a loss of some or all of your initial investment and therefore you should not invest money that you cannot afford to lose. You should be aware of all the risks associated with foreign exchange trading, and seek advice from an independent financial advisor if you have any doubts. Our linking to these sites does not constitute an endorsement of any products, services or the information found on them. Once you link to another site you are subject to the policies of the new site. By using this site, you agree to the Terms of Service, Privacy Policy and Risk Disclosure. Copyright 2017 Tradingvesting, LLC. All rights reserved. If you have any questions regarding the Online Economic Calendar application, please contact us: click here.
THIS BRIEF STATEMENT CANNOT, OF COURSE, DISCLOSE ALL THE RISKS AND OTHER ASPECTS OF THE COMMODITY MARKETS AND EQUITY MARKETS. PLEASE READ MORE AT: TERMS OF SERVICE.
|
|
|
|
| |
|
|
|
| |
|
|
|
|